
By Brian D.
With a new exam comes new topics. The redesigned SAT is going to make its debut come March 2016 armed with a hefty repertoire of new math topics. Among these is going to be statistics, something that you’ve likely seen on the Math II SAT Subject Test. If you’re like most other people, this subject (particularly probability) probably gives you frequent headaches. Even so, it’s not really anything serious to worry about.
Statistics looks confusing at first, but it’s really quite simple if you boil it down enough. Let’s go over some common topics:
1. Basic Fractions/Percentages
2. Factorials + Repeating Occurrences
3. Measures of Central Tendency
4. Standard Deviation
Basic Fractions/Percentages
You’ve probably seen this before. It goes like this:
P = # of favorable outcomes / # of total outcomes
where P is the probability of event X happening.
Factorials + Repeating Occurrences
You can easily tell when a problem is asking you to calculate a factorial if you see an exclamation mark (!) next to a number n. Here is the formula:
n! = n(n - 1)(n - 2) ... 1
Repeating occurrences isn’t actually an official type of question, but they do appear quite often. If a question asks you how many different ways the letters in a certain word or phrase can be arranged, then it’s this kind of question. The way you should go around solving this is to first find the factorial of the total amount of letters. Then for each letter than appears more than once, divide that first factorial you calculated by the factorial of the number of times the specified letter repeats. Keep on doing this until all remaining letters appear only once.
Measures of Central Tendency
This is a fancy way for saying mean, median, and mode. The mean is the sum of all numbers in a set divided by the amount of numbers there are. The median is the middle value of the data set, when the numbers are arranged in order. Finally, the mode is the value(s) that occurs the most frequently.

Source: http://www.ablongman.com/graziano6e/text_site/MATERIAL/statconcepts/mean.png
where x bar represents the mean, sigma X is the sum of all numbers within set X, and N is the total amount of numbers in set X.
Standard Deviation
This is one of the most important concepts in statistics. Standard deviation is, in essence, the average distance the values in the data set are from the mean. Standard deviation can go both ways (both above and below the mean). Usually there is a bar of three standard deviations, but it’s not a steadfast rule. Here’s the formula, which you should never try to calculate by hand while taking the test.
Source: https://s-media-cache-ak0.pinimg.com/originals/24/7d/88/247d88c2a9e349df58c0a4d4d0895676.jpg
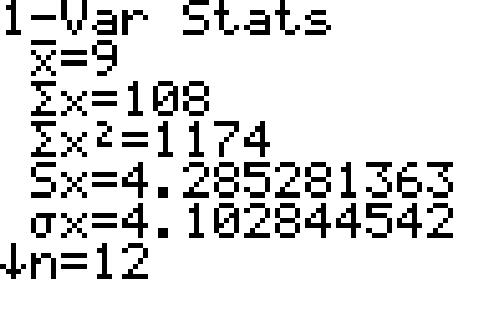
Don’t worry if this looks overwhelming and confusing; your graphing calculator can easily do all the math for you if you have a set of numbers. Here’s how you do so:
1. Go to mode and turn “stat wizards” off
2. Go to stat, edit
3. Input the numbers in your data set in any order
4. Go to stat, calc, 1 vars stats
Scroll down and you’ll see the following:
Source: https://dr282zn36sxxg.cloudfront.net/datastreams/f-d%3Ad6e8dfdd1d1727a886b8c9c130b98d10bd645f2eed200544827c2c42%2BIMAGE%2BIMAGE.1